Automatic Cell Detection of Liver Tissue Section Image
Automatic Cell Detection of Liver Tissue Section Image
OUTPUT
1 Introduction
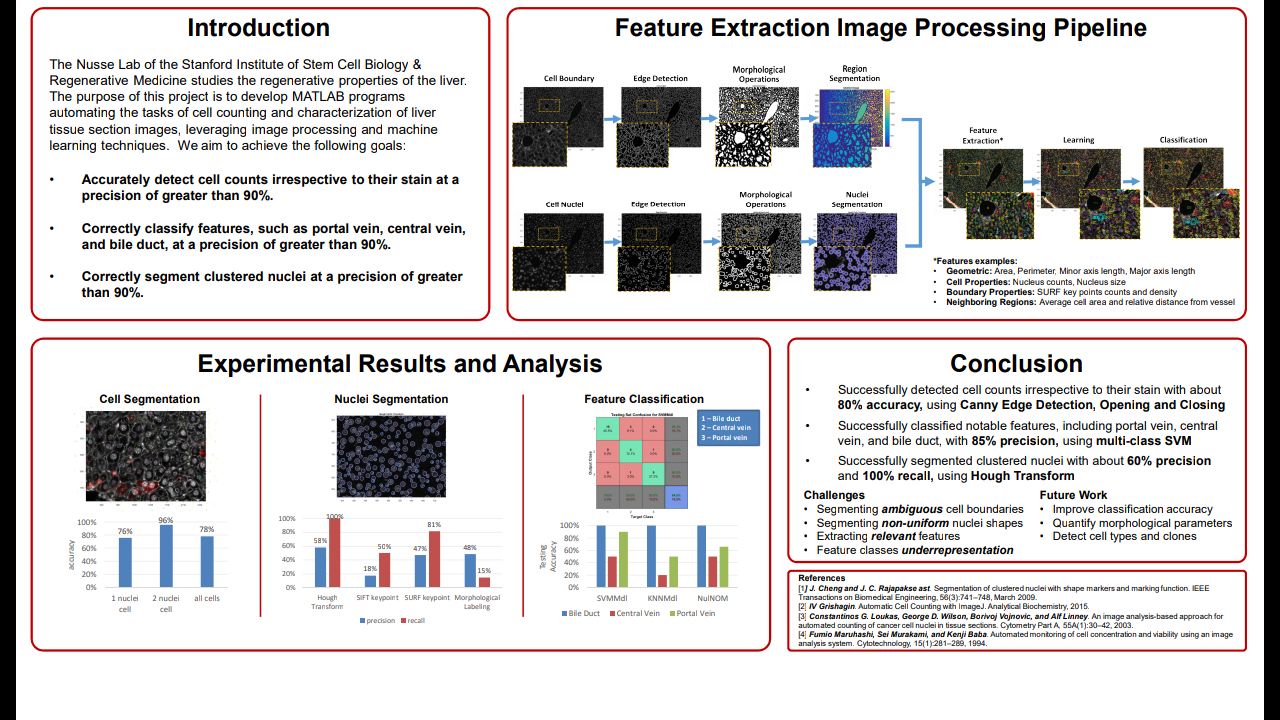
The Nusse Lab of the Stanford Institute of Stem Cell Biology & Regenerative Medicine studies the regenerative properties of the liver. The goal of this project is to help graduate students in the Nusse Lab automate the tasks of cell counting and characterization of liver tissue section images, leveraging image processing and machine learning techniques. Currently, the cell counting tasks of tissue section images are done by hand, in a manual and laborious manner, because general purpose image processing software such as Image J does not adequately address the specific need for these types of images and there are no commercially
available products solving this problem [Gri15]. While previous projects have dealt with cell counting or characterization of cell culture images, this project tackles the more difficult problems presented by tissue section images due to their non-homogeneous nature and the high levels of details present in these images [MMB94]. For example, tissue section images typically contains an order of magnitude more resolution and features than cell culture images, as shown in Figure 1. (a) Sample tissue cross-section (b) Sample cell culture Figure 1: Tissue cross section vs. cell culture There are numerous benefits associated with potentially automating these tasks, based on a survey of existing literature [WGvH+16, MMB94]. Automating these tasks using image processing and machine learning may result in significant time savings as well as reduce measurement variabil-
ity due to operator-dependent and parameter-sensitive conditions. Additionally, automation has the potential of quantifying numerous cell morphology characteristics that are difficult or expensive to do so manually [Gri15].
2 Goals and Proposed Tasks
This project aims to achieve at least two of the following goals.
1. Accurately detect cell counts irrespective to their stain at a precision of greater than 90%.
2. Correctly classify features, such as portal vein, central vein, and bile duct, at a precision
FOR BASE PAPER PLEASE MAIL US
DOWNLOAD SOURCE CODE CLICK HERE
OUTPUT
1 Introduction
The Nusse Lab of the Stanford Institute of Stem Cell Biology & Regenerative Medicine studies the regenerative properties of the liver. The goal of this project is to help graduate students in the Nusse Lab automate the tasks of cell counting and characterization of liver tissue section images, leveraging image processing and machine learning techniques. Currently, the cell counting tasks of tissue section images are done by hand, in a manual and laborious manner, because general purpose image processing software such as Image J does not adequately address the specific need for these types of images and there are no commercially
available products solving this problem [Gri15]. While previous projects have dealt with cell counting or characterization of cell culture images, this project tackles the more difficult problems presented by tissue section images due to their non-homogeneous nature and the high levels of details present in these images [MMB94]. For example, tissue section images typically contains an order of magnitude more resolution and features than cell culture images, as shown in Figure 1. (a) Sample tissue cross-section (b) Sample cell culture Figure 1: Tissue cross section vs. cell culture There are numerous benefits associated with potentially automating these tasks, based on a survey of existing literature [WGvH+16, MMB94]. Automating these tasks using image processing and machine learning may result in significant time savings as well as reduce measurement variabil-
ity due to operator-dependent and parameter-sensitive conditions. Additionally, automation has the potential of quantifying numerous cell morphology characteristics that are difficult or expensive to do so manually [Gri15].
2 Goals and Proposed Tasks
This project aims to achieve at least two of the following goals.
1. Accurately detect cell counts irrespective to their stain at a precision of greater than 90%.
2. Correctly classify features, such as portal vein, central vein, and bile duct, at a precision
FOR BASE PAPER PLEASE MAIL US
DOWNLOAD SOURCE CODE CLICK HERE


Comments
Post a Comment